Getting a Graph Representation of a Pipeline in Apache Beam
- 3 minsGetting a pipeline representation in Apache Beam explained step-by-step.
Intro
Constructing advanced pipelines, or trying to wrap your head around the existing pipelines, in Apache Beam can sometimes be challenging. We have seen some nice visual representations of the pipelines in the managed Cloud versions of this software, but figuring out how to get a graph representation of the pipeline required a little bit of research. Here is how it is done in a few steps using Beam’s Java SDK.
TL;DR: Getting Graph Representation
If you just want to see a few lines that let you generate the DOT representation of the graph, here it is:
import org.apache.beam.runners.core.construction.renderer.PipelineDotRenderer;

Pipeline p = Pipeline.create(options);
// do stuff with your pipeline
String dotString = PipelineDotRenderer.toDotString(p);
Now, if you want a slightly more comprehensive example, keep on reading.
A Full Example
Here we will be using word count example, particularly the MinimalWordCount class.
Adding Maven Dependency
First, we need to add a dependency to the Maven file under <dependencies> section:
<dependencies>
    <!-- ... all the other dependencies you may have -->
    <dependency>
        <groupId>org.apache.beam</groupId>
        <artifactId>beam-runners-core-construction-java</artifactId>
        <version>${beam.version}</version>
    </dependency>
</dependencies>
The Code
Now, we will need to add a few imports (assuming you already added the Maven dependency mentioned earlier):
import org.apache.beam.runners.core.construction.renderer.PipelineDotRenderer;
import org.slf4j.Logger;
import org.slf4j.LoggerFactory;
To get the DOT representation of the pipeline graph we will be passing the pipeline object to the PipelineDotRenderer class, and in this example, we are only logging the output to the console (hence the log4j imports).
// Create the Pipeline object with the options we defined above
Pipeline p = Pipeline.create(options);

// ... do stuff with your pipeline ...

// Add this piece of code just before running the pipeline:
final Logger log = LoggerFactory.getLogger(MinimalWordCount.class);
String dotString = PipelineDotRenderer.toDotString(p);
log.info("MY GRAPH REPR: " + dotString);

p.run().waitUntilFinish();
That’s it. To see the code in action, run it from the command line:
$ mvn compile exec:java \
        -Dexec.mainClass=org.apache.beam.examples.MinimalWordCount \
        -Pdirect-runner
This code will produce a DOT representation of the pipeline and log it to the console.
A Complete Example
A fully working example can be found in my repository, based on MinimalWordCount code. There, in addition to logging to the console, we will be storing the DOT representation to a file.
In the next section, we will have a brief look at what can be done with the DOT representations.
What Now?
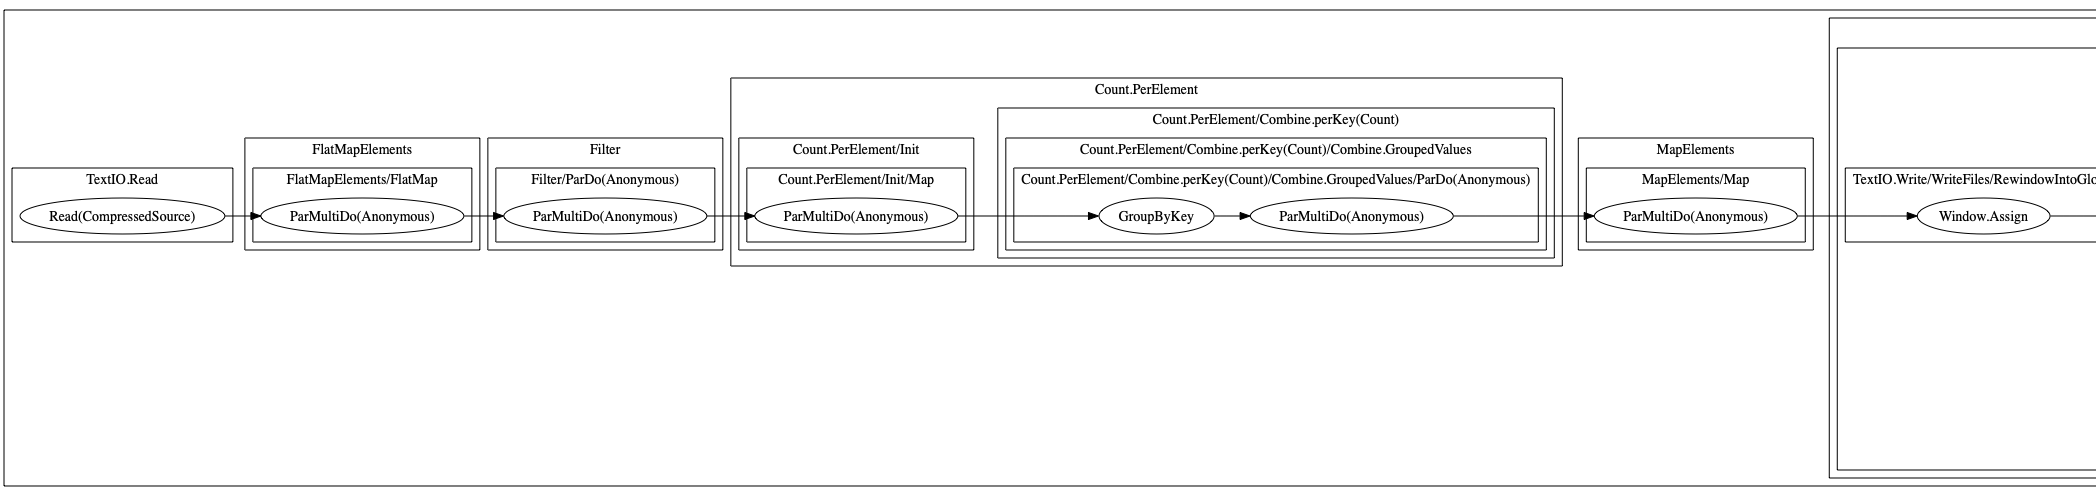
Now that we have a DOT representation of the pipeline graph, we can use it to get a better understanding of the pipeline. For instance, you can generate an SVG or a PNG image from the data. Note that the generated graph might be a bit verbose, but gives a good overview of the pipeline graph.
Here, I have also included examples of the DOT graph and the PNG file generated for that particular pipeline.
Assuming that you have Graphviz tools installed, you can convert a DOT file to a PNG image using this command:
$ dot -Tpng -o pipeline_graph.png pipeline_graph.dotIn addition to Grapgviz (Wikipedia link), there are also online services for converting DOT graphs to graphical representations, like this one.